
What is a Cash Secured Put? #
Think of it as getting paid to place a limit buy order. You’re telling the market: “I’ll buy this stock at $X price, and you’ll pay me for making that commitment.”
The Mechanics #
Components of a Cash Secured Put #
- Cash Reserve: You hold enough cash to buy 100 shares at the strike price
- Short Put Option: You sell 1 put option contract (covers 100 shares)
- Strike Price: The price at which you agree to buy the shares
- Premium: The income you receive for selling the put option
- Expiration Date: When the option contract expires
Visual Representation #
graph TD
    A[You Have $5,000 Cash
Want to Buy Stock at $50] --> B{Sell 1 Put Option}
    B --> C[Strike Price: $50
Premium Received: $1.50/share
Expiration: 30 days]
    C --> D{At Expiration}
    D -->|Stock > $50| E[Keep Cash
Keep Premium
Total Profit: $150]
    D -->|Stock < $50| F[Buy 100 Shares at $50
Effective Cost: $48.50/share
You own stock you wanted!]
Practical Example #
Let’s walk through a real-world scenario:
Setup #
- Stock: Apple (AAPL)
- Current Price: $180 per share
- Your Target Buy Price: $170
- Cash Reserved: $17,000 (enough to buy 100 shares at $170)
The Trade #
You sell 1 put option:
- Strike Price: $170
- Premium: $2.50 per share
- Expiration: 30 days
- Premium Received: $250 (100 shares × $2.50)
Possible Outcomes #
Scenario: Stock Stays Above $170
Day 0:  Stock at $180, Sell put for $2.50/share
Day 30: Stock at $175 (above strike)

Result:
- Keep your $17,000 cash
- Keep the $250 premium
- Annualized return on cash: ~17.6% ($250/$17,000 × 12 months)
- Can sell another put option next monthYou keep your cash AND the premium. Rinse and repeat next month!
Scenario: Stock Drops Below $170
Day 0:  Stock at $180, Sell put for $2.50/share
Day 30: Stock at $160 (below strike)

Result:
- You buy 100 shares at $170 (the strike price)
- Premium kept: $250
- Effective cost per share: $167.50 ($170 - $2.50 premium)
- Current value: $16,000 (100 × $160)
- Paper loss: $750 (but you own stock you wanted!)You now own the shares at your target price minus the premium. If you were bullish on the stock anyway, this is a win!
Side-by-Side Comparison
| Scenario | Stock Price | Cash Status | Premium | Shares | Net Position |
|---|---|---|---|---|---|
| No Assignment | $175 | Keep $17,000 | +$250 | 0 | +$250 profit |
| Assigned | $160 | Spent $17,000 | +$250 | 100 @ $167.50 effective | Own stock at discount |
| Just Bought Stock | $160 | Spent $18,000 | $0 | 100 @ $180 | -$2,000 loss |
Cash secured puts let you get paid while waiting for your target price. Even if assigned, you bought cheaper than the market price when you sold the put!
Cash Secured Put Payoff Diagram #
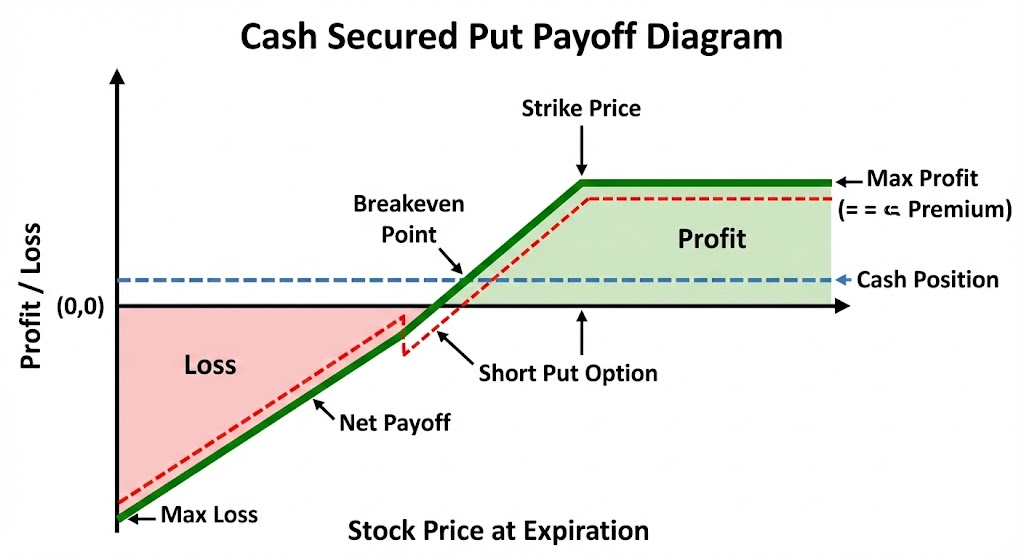
Visual P&L Diagram #
When to Use Cash Secured Puts #
- Bullish on a stock: You want to own shares but think the current price is too high
- Generate income while waiting: Get paid to wait for your target entry price
- Comfortable owning shares: You actually want to buy if assigned
- Higher IV environment: When implied volatility is elevated, premiums are juicier
- Bearish outlook: If you think the stock will crash, don’t sell puts on it
- Don’t want to own the stock: Never sell puts on stocks you wouldn’t buy
- Need the cash soon: Your cash is tied up until expiration or assignment
- Before earnings/news: Major events can cause large price swings
How to Choose the Strike Price #
Using Delta as a Guide #
Delta measures the probability of an option being in-the-money at expiration. For put selling:
| Delta | Probability of Assignment | Premium | Risk Level |
|---|---|---|---|
| -0.15 | ~15% | Lower | Conservative |
| -0.25 | ~25% | Moderate | Balanced |
| -0.35 | ~35% | Higher | Aggressive |
Strike Price Selection Strategy #
graph LR
    A[Current Stock Price] --> B{Your Goal?}
    B -->|Maximum Premium| C[At-the-Money Strike
Higher risk of assignment]
    B -->|Balanced| D[5-10% Below Current
Delta around -0.25]
    B -->|Conservative| E[15-20% Below Current
Delta around -0.15]

    classDef aggressive fill:#ef4444,stroke:#dc2626,color:#fff
    classDef balanced fill:#f59e0b,stroke:#d97706,color:#fff
    classDef conservative fill:#22c55e,stroke:#16a34a,color:#fff

    class C aggressive
    class D balanced
    class E conservative
Risk/Reward Profile #
Maximum Gain #
Max Profit = Premium Received

Example: $250 (the premium you collected)
Your profit is capped at the premium - you can’t make more even if the stock moons.
Maximum Loss #
Max Loss = (Strike Price × 100) - Premium Received

Example: ($170 × 100) - $250 = $16,750
This is the same risk as owning the stock minus the premium. Only sell puts on stocks you actually want to own!
Breakeven Point #
Breakeven = Strike Price - Premium per Share

Example: $170 - $2.50 = $167.50
Visual Comparison: Cash Secured Put vs Buying Stock #
graph LR
    A[Want to Own Stock] --> B[Buy Stock Now]
    A --> C[Sell Cash Secured Put]

    B --> D[Pay Full Price
Immediate Ownership
No Premium Income]

    C --> E[Get Paid to Wait
Buy at Discount if Assigned
May Not Get Shares]

    classDef immediate fill:#3b82f6,stroke:#2563eb,color:#fff
    classDef strategic fill:#f59e0b,stroke:#d97706,color:#fff

    class B immediate
    class C strategic
Advanced Considerations #
Rolling the Put #
If the stock is approaching your strike and you don’t want to be assigned yet, you can “roll” the put:
Step 1: Buy back the current put (close position)
Step 2: Sell a new put with later expiration or lower strike
Example:
- Current: $170 strike expiring in 5 days, stock at $172
- Action: Buy back for $1.50, sell $165 strike 30 days out for $3
- Net credit: $1.50 per share ($150 total)
The Wheel Strategy #
Cash secured puts are often the entry point for the popular “Wheel Strategy”:
graph TD
    A[Sell Cash Secured Put] -->|Not Assigned| A
    A -->|Assigned - You Own Shares| B[Sell Covered Call]
    B -->|Not Called Away| B
    B -->|Called Away - Shares Sold| A
Combine cash secured puts with covered calls: Sell puts until assigned, then sell calls until shares are called away. Repeat for consistent income.
Real-World Performance #
Monthly Income Example #
Cash Reserve: $50,000 across 5 stocks ($10,000 each)
| Month | Avg Premium | Total Premium | Annualized Yield |
|---|---|---|---|
| Jan | $1.80/share | $900 | 21.6% |
| Feb | $2.10/share | $1,050 | 25.2% |
| Mar | $1.50/share | $750 | 18.0% |
| Q1 Total | $5.40 | $2,700 | 21.6% annualized |
Assumptions: All puts expired worthless (stocks stayed above strikes)
Key Takeaways #
- Income While Waiting: Get paid to wait for stocks to reach your target buy price
- Limited Profit: Your max gain is the premium received
- Significant Risk: You could be forced to buy shares at the strike price even if the stock drops much lower
- Best for Stocks You Want: Only sell puts on companies you’d happily own
- Works with Covered Calls: Part of the popular “Wheel Strategy” for recurring income
Common Mistakes to Avoid #
- Selling puts on stocks you don’t want - If assigned, you’re stuck with shares you never wanted
- Ignoring cash requirements - Make sure you actually have the cash to cover assignment
- Chasing high premiums - Super high premiums usually mean super high risk
- Setting strikes too close - ATM strikes have 50%+ chance of assignment
- Forgetting about dividends - Ex-dividend dates can trigger early assignment
Conclusion #
Cash secured puts are a smart way to generate income while waiting to buy stocks you already want to own. They work best when you:
- Have a list of quality stocks you’d love to own at lower prices
- Want to generate income from idle cash in your brokerage account
- Accept that you might be assigned and will own the shares
- Understand that your profit is limited to the premium received
Remember: Only sell puts on stocks you actually want to buy. If you get assigned, you should be excited to own the shares, not disappointed!
Disclaimer: This is educational content only. Options trading involves risk and is not suitable for all investors. Do your research!