
This is the story of the Benner Cycle, and honestly, it’s one of the most fascinating rabbit holes in finance.
I’m going to break down exactly what this cycle is, see if it has any teeth in today’s wild markets, and figure out if this old farmer’s wisdom can actually make us better investors.
Who Was Samuel Benner? #
Samuel Benner wasn’t some Wall Street guru. He was an Ohio farmer who got absolutely wiped out financially by the Panic of 1873. Instead of just licking his wounds, he became obsessed with figuring out why markets moved in such dramatic, repeating waves.
So, he hit the books—studying everything from pig iron prices to corn harvests—and in 1875, he published a book with his findings. His work boiled down to a simple, powerful idea:
The market moves in cycles, and these cycles can be charted.
The Three Flavors of Market Years #
Benner’s system wasn’t complicated. He categorized years into three distinct types:
Panic Years #
The big ones. Years of irrational fear (or greed) where prices either crash through the floor or launch into the stratosphere.
- 2008 Financial Crisis
- Dot-com bust (2000-2002)
- April 2025 “Liberation Day”
It’s when things get crazy.
Good Times #
The boom years. Prices are high, everyone’s making money, and your portfolio looks brilliant.
This is the best time to sell your assets and take profits. Don’t get greedy.
Hard Times #
The winter of the market cycle. Prices are low, sentiment is gloomy, and it feels like the world is ending.
Buy. Buy stocks, buy assets, and hold on until the “Good Times” roll back around.
What Does the Cycle Look Like? #
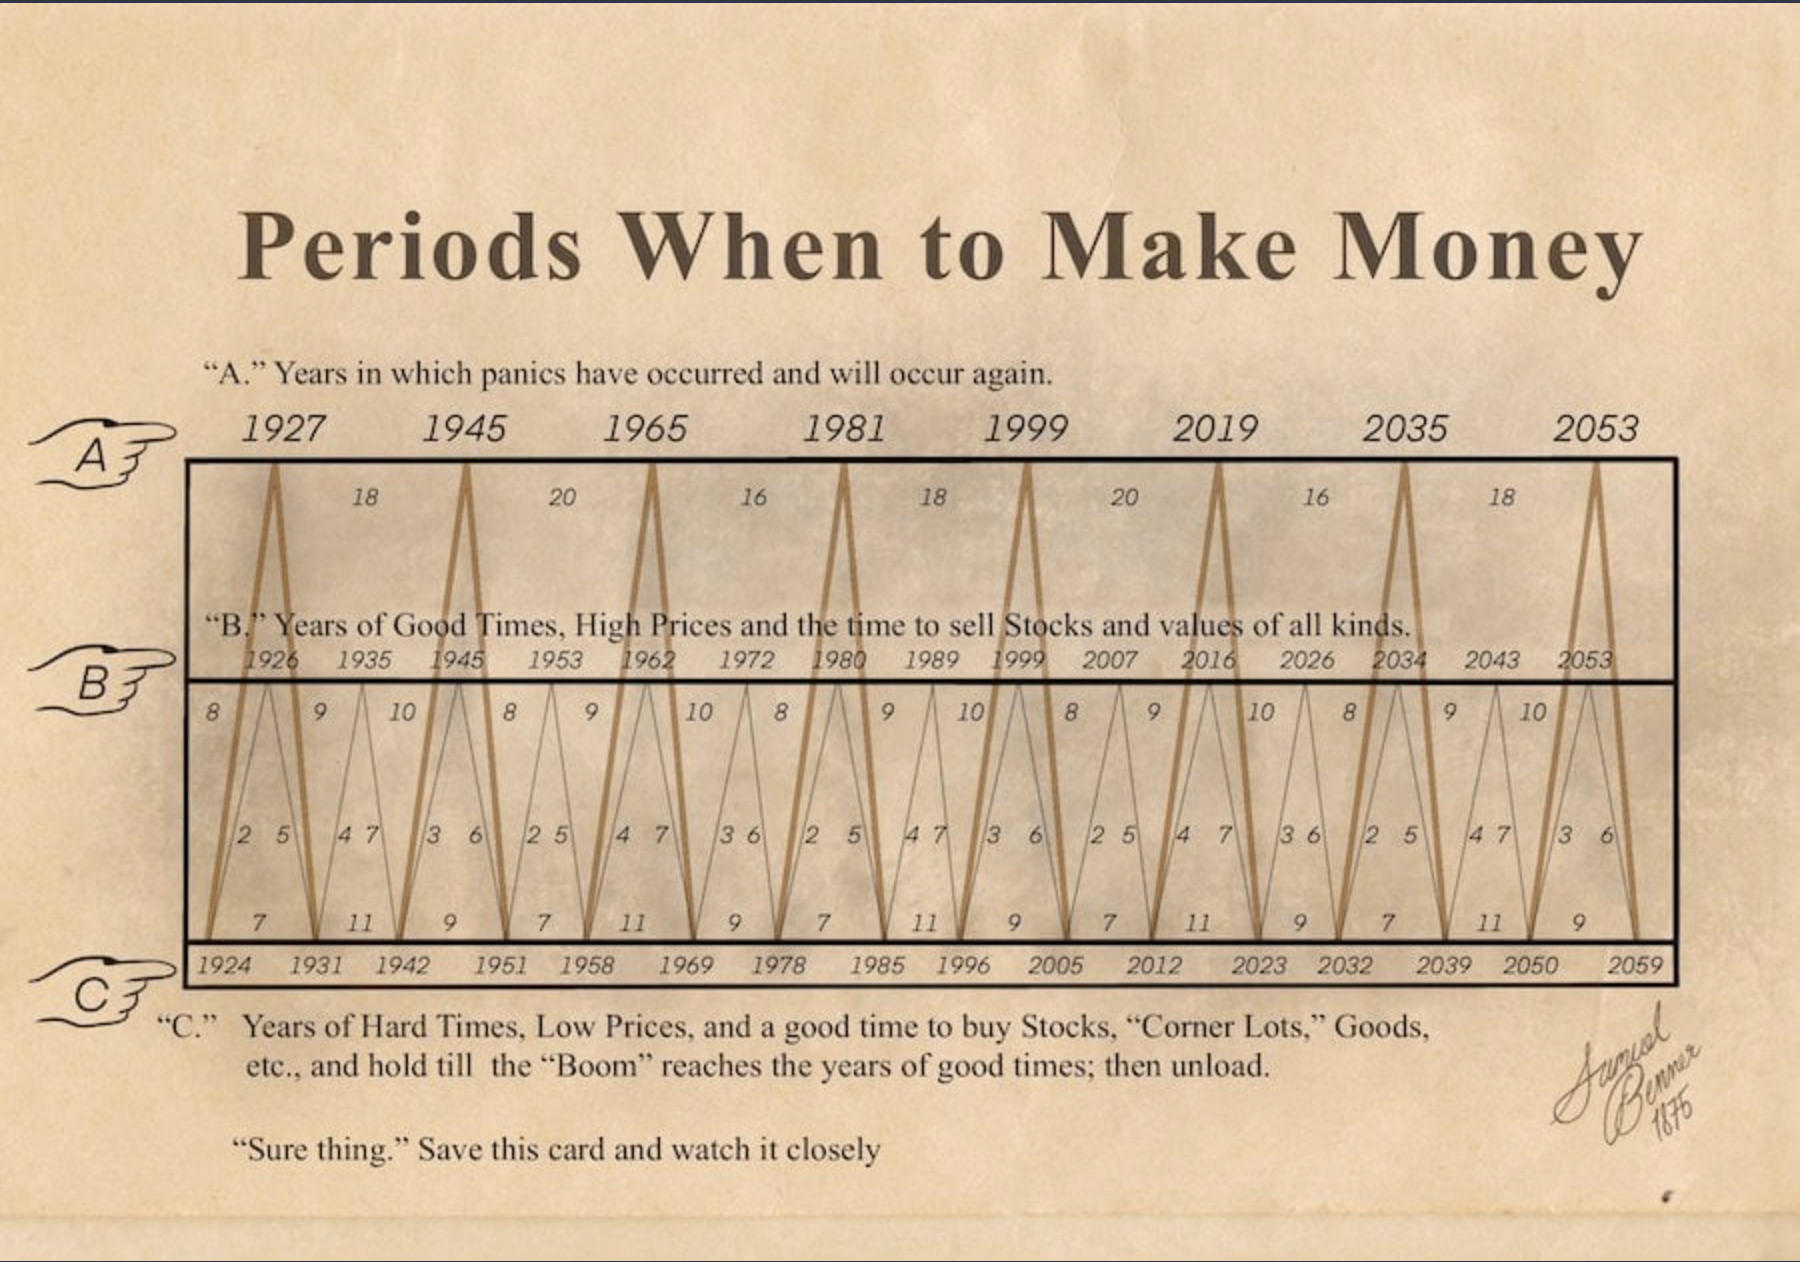
This is where it gets interesting. Benner laid out his predictions on a hand-drawn chart, which has since been adapted and passed down.
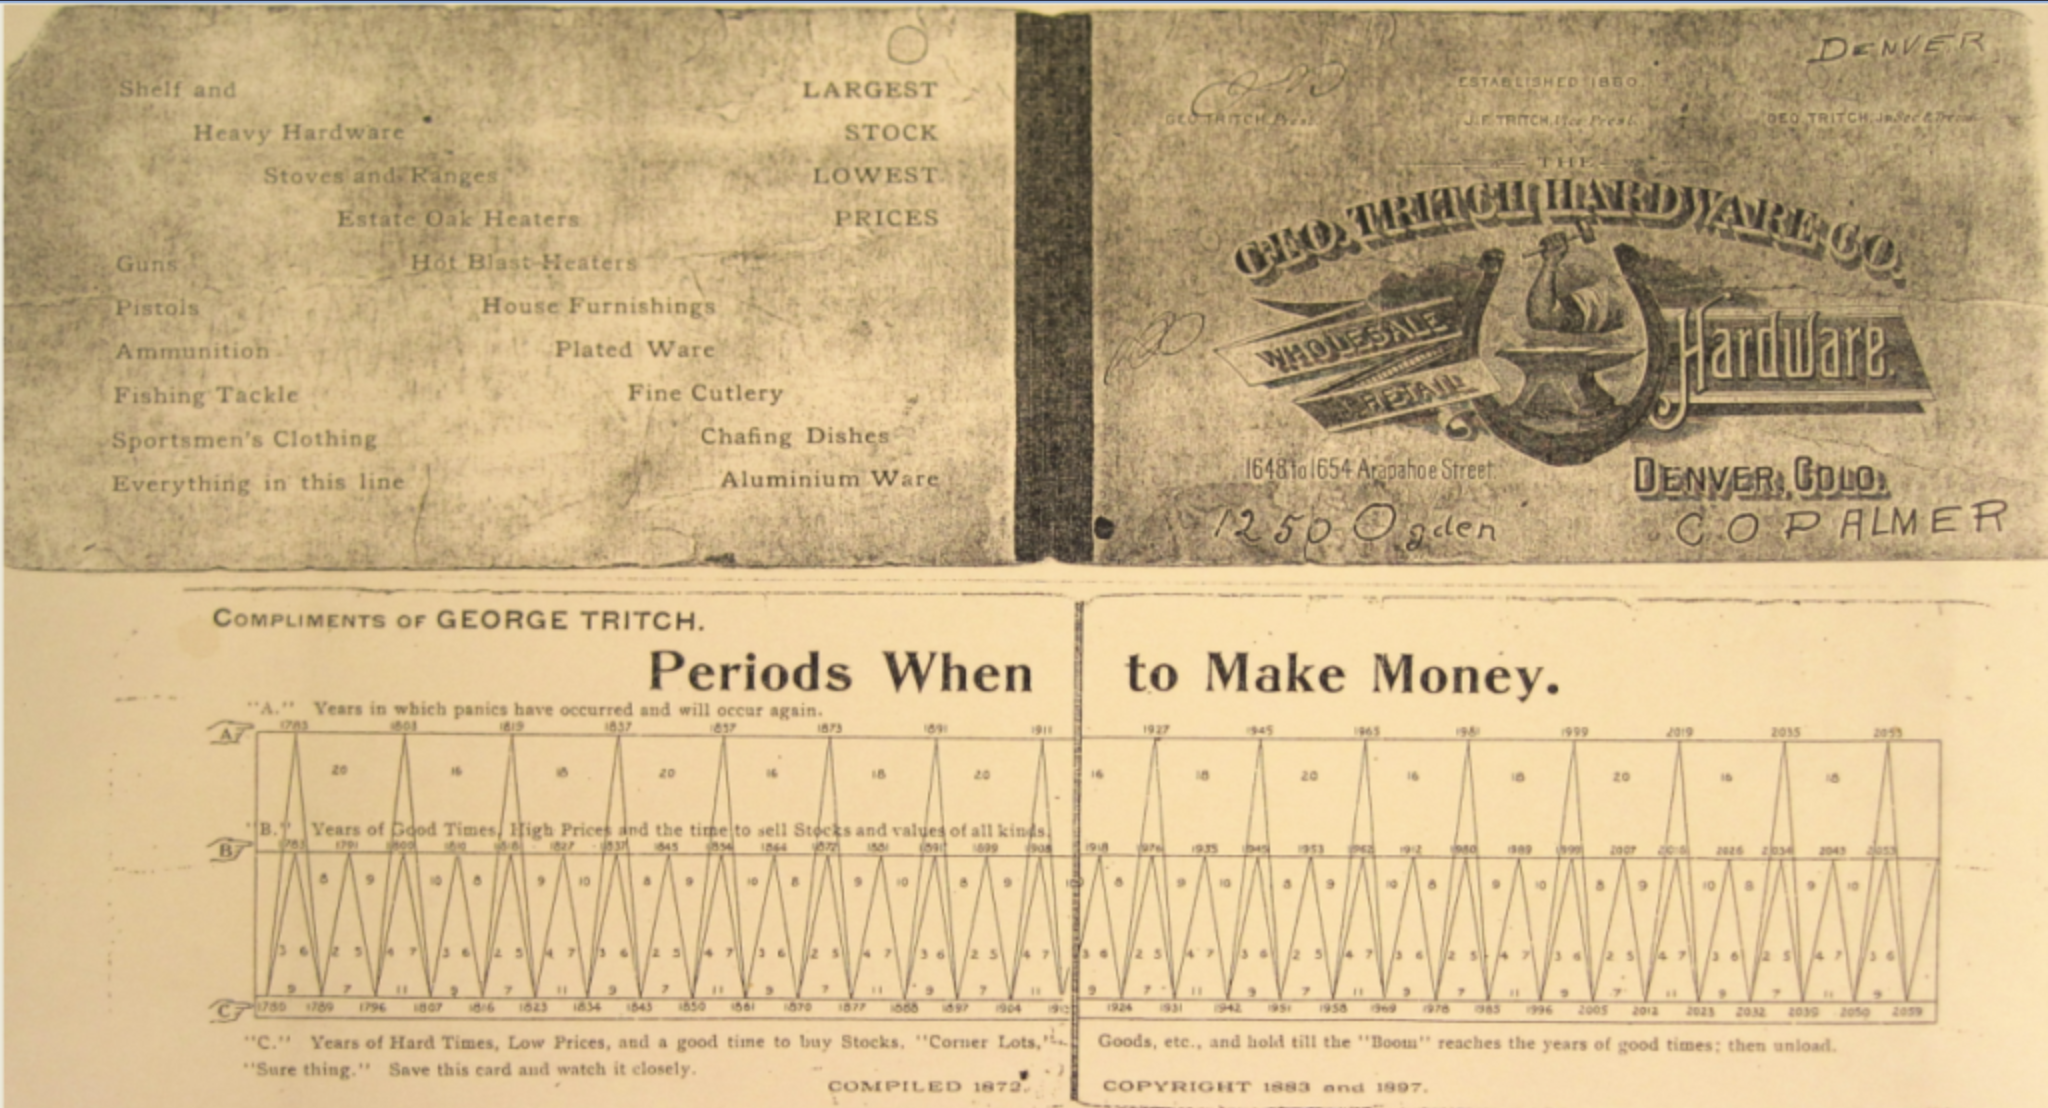
A visual representation of Benner’s cyclical chart, showing the waves of panic, good times, and hard times.
The Rhythm of the Market #
Benner identified a recurring pattern in market tops of 8, 9, and 10 years. This simple rhythm forms the backbone of his forecast for “Good Times” to sell.
Similarly, he found patterns for market bottoms, giving him his “Hard Times” to buy. It was a mechanical, almost agricultural way of looking at finance—planting during the bad years to harvest during the good ones.
For a while, it seemed to work surprisingly well, lining up with several major market events long after Benner was gone.
Should You Trade Using a 150-Year-Old Chart? #
This is the million-dollar question. It’s one thing to look at a historical chart and nod along, but it’s another thing entirely to bet your hard-earned money on it.
The “Map vs. GPS” Analogy #
Here’s how I see it:
The Benner Cycle is like a hand-drawn map of a coastline from the 1800s. It gives you the general shape, the major capes, the big bays. It’s useful for general orientation.
But you would never use it as a GPS to navigate a super-tanker through a narrow, rocky channel in a storm.
The economy of 1875 was based on agriculture and railroads, pegged to a gold standard. Today’s market is a complex, globalized, high-frequency, algorithm-driven beast connected in ways Benner could never have imagined.
The biggest pitfall is our own brain. When you look at the chart, it’s incredibly easy to see the times it worked and ignore the times it didn’t. This is called confirmation bias, and it’s a great way to lose money.
How to Actually Use the Benner Cycle #
So, if we’re not using it as a trading signal, is it useless? Not at all.
Its real value isn’t in its predictive power, but in its ability to help us manage our own worst enemy: our emotions.
A Tool for Emotional Discipline #
When the market is in “Hard Times” and everyone is panicking, having a 150-year-old chart that says “BUY” can be a powerful psychological tool.
It can give you the courage to follow Warren Buffett’s advice and “be greedy when others are fearful.”
A Sanity Check #
When the market is euphoric and stories of overnight millionaires are everywhere (what Benner called “Good Times”), his chart serves as a sober reminder.
“Hey, maybe don’t go all-in at the top.” Take some profits.
The Real Secret Weapon #
The real secret weapon in investing isn’t a perfect timing tool. It’s patience.
The Benner Cycle, for all its flaws, is a testament to the fact that markets are cyclical:
| Phase | What Happens | What To Do |
|---|---|---|
| Hard Times | Prices low, sentiment gloomy | Buy and hold |
| Recovery | Prices rising, optimism returns | Stay invested |
| Good Times | Prices high, euphoria | Take profits |
| Panic | Prices crash, fear everywhere | Prepare to buy |
Bad times are followed by good times, and good times are followed by bad.
Conclusion #
So, can a farmer from 1875 predict the market?
No. Don’t use it to time the market.
Can it make you a smarter, more level-headed investor? Absolutely.
The Benner Cycle is a fascinating historical artifact and a brilliant mental model:
- Use it to understand that markets have a natural ebb and flow
- Use it to check your own greed and fear
- Don’t use it to time specific trades
The real, boring, and effective secret to building wealth remains the same: buy good assets, diversify, and give it time. Lots of time.